Boost Your Business with Key Sales Metrics

Do you want to take your business to the next level? Are you looking for a way to improve your sales performance and drive revenue growth? The answer lies in tracking key sales metrics. But what are sales metrics and how can they help you optimize your sales efforts? In this ultimate guide to sales metrics, we will dive deep into the world of performance evaluation, revenue tracking, and data analysis to uncover the key metrics that can transform your business.
When it comes to evaluating sales performance, relying on intuition or guesswork is simply not enough. Sales metrics provide the necessary insights into your business’s performance, allowing you to make data-driven decisions. By tracking metrics like total revenue, market penetration, customer acquisition, and average customer lifetime value (CLV), you can identify areas for improvement, set realistic sales targets, and drive results.
But are you tracking the right metrics? Are there hidden opportunities and blind spots in your sales strategy that you’re not aware of? In this guide, we will explore the essential sales metrics that every business should be tracking. From revenue tracking to sales analytics, we’ll cover everything you need to know to measure and optimize your sales performance.
So, are you ready to discover the power of sales metrics? Join us on this journey and unlock the potential of your business.
Key Takeaways:
- Tracking key sales metrics is crucial for optimizing your sales efforts and driving revenue growth.
- Sales metrics provide insights into your business’s performance and help you make data-driven decisions.
- By tracking the right metrics, you can identify areas for improvement and set realistic sales targets.
- The ultimate guide to sales metrics will cover essential metrics like total revenue, market penetration, customer acquisition, and more.
- Unlock the potential of your business by discovering the power of sales metrics.
What are sales metrics?
Sales metrics play a crucial role in evaluating the performance of individuals, teams, and companies in the sales domain. These data points provide valuable insights into the effectiveness of sales strategies, track progress towards goals, and help identify areas for improvement. By analyzing sales metrics, businesses can make data-driven decisions to optimize their sales efforts and achieve success.
When it comes to sales metrics, there is a wide range of factors that can be tracked. These metrics include:
- Total revenue: The overall revenue generated by sales activities.
- Revenue by product or service: The distribution of revenue across different products or services offered.
- Market penetration: The extent to which a business has captured a specific market.
- Percentage of revenue from new business: The proportion of revenue generated from new customers.
- Percentage of revenue from existing customers: The proportion of revenue generated from existing customers.
- Year-over-year growth: The rate at which revenue has increased or decreased compared to the previous year.
- Average customer lifetime value (CLV): The projected revenue a business can expect to generate from a single customer over their lifetime.
- Net promoter score (NPS): A measure of customer satisfaction and loyalty.
- Number of deals lost to competition: The number of potential deals that were lost to competitors.
- Cost of selling: The expenses associated with the sales process.
- Average length of sales cycle: The average duration it takes to close a sale.
- Weighted value of pipeline: The estimated value of potential deals in the sales pipeline.
- Annual contract value (ACV): The average value of contracts signed annually.
- Win rate: The percentage of deals won compared to the total number of deals.
- Conversion rate by sales funnel stage: The percentage of prospects that progress through each stage of the sales funnel.
- Frequency/volume of new opportunities added to the pipeline: The rate at which new potential deals are being added to the sales pipeline.
By tracking these sales metrics, businesses can evaluate their performance, identify areas for improvement, and make data-driven decisions to drive results and grow revenue.

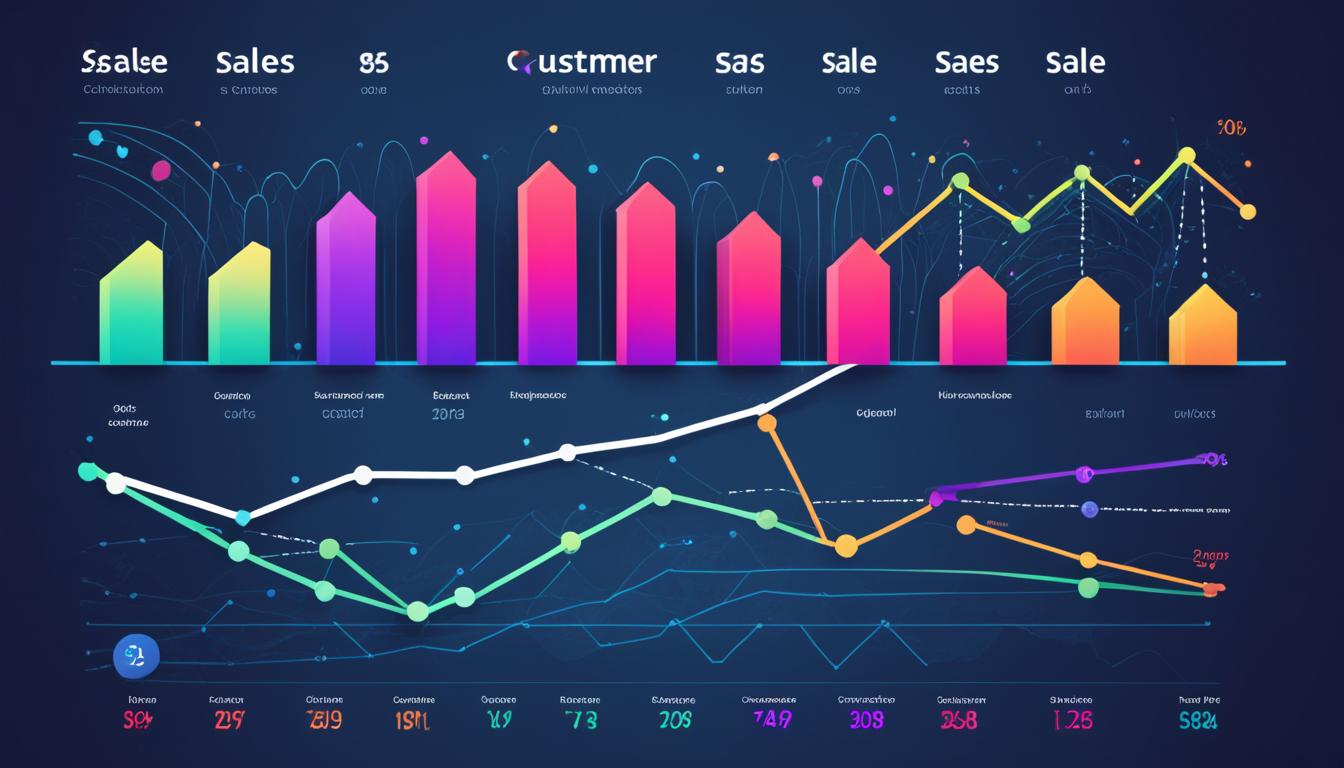
The image above represents the importance of performance evaluation in sales.
| Sales Metric | Description |
|---|---|
| Total Revenue | The overall revenue generated by sales activities. |
| Revenue by Product or Service | The distribution of revenue across different products or services offered. |
| Market Penetration | The extent to which a business has captured a specific market. |
Table: Example of Sales Metrics
Key Sales Metrics to Track
To effectively measure the performance of your sales efforts, it is crucial to track key sales metrics. These metrics provide valuable insights into various aspects of your sales performance and can help you set and achieve your sales targets. By tracking and analyzing these metrics, you can make data-driven decisions to drive results and grow your revenue.
Revenue Tracking
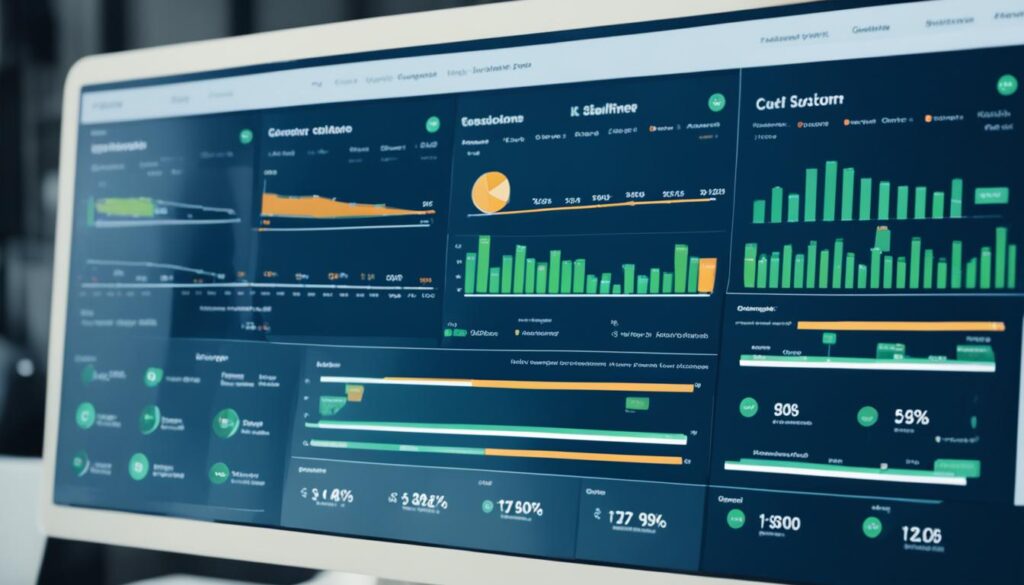
One of the most important sales metrics to track is total revenue. This metric gives you a comprehensive view of your overall sales performance and reflects the success of your entire sales team. By monitoring your revenue over time, you can identify trends and patterns, understand the impact of your sales initiatives, and make informed decisions to optimize your revenue generation.
![]()
| Sales Metric | Description |
|---|---|
| Total Revenue | The overall revenue generated by your sales team |
| Revenue by Product or Service | The revenue generated by each individual product or service you offer |
| Market Penetration | The percentage of potential customers that you have reached in your target market |
| Percentage of Revenue from New Business | The portion of your revenue that comes from new customers |
| Percentage of Revenue from Existing Customers | The portion of your revenue that comes from repeat business |
| Year-over-Year Growth | The rate at which your revenue is growing compared to the previous year |
| Average Customer Lifetime Value (CLV) | The predicted revenue you can expect to generate from a single customer over the course of their relationship with your business |
Sales Performance Tracking
Tracking sales metrics also enables you to evaluate the performance of your sales team and individual sales reps. These performance metrics help you identify top performers, recognize areas for improvement, and provide targeted coaching to maximize results.
| Sales Metric | Description |
|---|---|
| Net Promoter Score (NPS) | A measure of customer satisfaction and loyalty that indicates the likelihood of customers recommending your product or service to others |
| Number of Deals Lost to Competition | The number of potential sales that were lost to competing companies |
| Cost of Selling | The average cost incurred to close a deal or acquire a customer |
| Average Length of Sales Cycle | The average amount of time it takes to close a sale from the initial contact to the final purchase |
| Weighted Value of Pipeline | The value of potential sales opportunities in your pipeline, considering the probability of closing each deal |
| Annual Contract Value (ACV) | The average annual value of a customer contract or subscription |
By tracking these sales metrics, you can evaluate your sales performance, identify areas for improvement, and make data-driven decisions to drive results. Remember, continuous monitoring and analysis of your sales metrics is key to achieving sustainable growth and success in your business.
Leading and Lagging Indicators in Sales
In sales, understanding the performance of your business is crucial for success. By tracking key sales metrics and indicators, you can gain valuable insights into your revenue, market penetration, customer acquisition, and overall sales strategy. In this section, we will explore the concept of leading and lagging indicators and how they can help you evaluate and improve your sales performance.
What are Leading Indicators?
Leading indicators in sales are metrics that provide insights into future performance. They help you make proactive decisions and adjust your sales strategy to achieve sales targets. By tracking leading indicators, you can identify early signs of success or challenges and take necessary actions to drive results.
Examples of leading indicators include:
- Market penetration: Measures the percentage of your target market you have reached and can help you gauge your market share and potential for growth.
- Percentage of revenue from new business: Shows the proportion of your revenue generated from new customers, indicating the effectiveness of your customer acquisition efforts.
- Frequency/volume of new opportunities added to the pipeline: Indicates the number of new potential opportunities you are generating, giving you an idea of your future sales potential.
What are Lagging Indicators?
Lagging indicators, on the other hand, measure past performance and provide insights into the overall effectiveness of your sales efforts. They allow you to evaluate the outcome of your sales strategy and identify areas for improvement.
Examples of lagging indicators include:
- Total revenue: Represents the overall sales revenue generated within a specific period and helps you assess the financial health of your business.
- Revenue by product or service: Breaks down your revenue by different products or services, allowing you to identify your best-performing offerings and opportunities for growth.
- Average length of sales cycle: Measures the time it takes to close a deal from start to finish, giving you insights into your sales efficiency and potential bottlenecks.
By tracking both leading and lagging indicators, you can gain a holistic view of your sales performance. Leading indicators help you course-correct your sales strategy, while lagging indicators provide a retrospective evaluation of your efforts. By analyzing these metrics together, you can make informed decisions and drive your sales strategy to achieve better results.
Now that we understand the concepts of leading and lagging indicators, let’s explore their application in real-world sales scenarios.
SaaS Sales Metrics
For SaaS businesses, tracking and analyzing sales metrics is crucial for optimizing strategies and driving growth. By monitoring key SaaS sales metrics, you can evaluate the health and performance of your sales efforts, identify areas for improvement, and make data-driven decisions to increase revenue and maximize success.
Monthly Recurring Revenue (MRR)
Monthly Recurring Revenue (MRR) is a key metric that measures the predictable and consistent revenue generated from your SaaS subscriptions on a monthly basis. Tracking MRR allows you to gauge the stability and growth of your business, identify trends, and make informed decisions to drive revenue.
Annual Recurring Revenue (ARR)
Annual Recurring Revenue (ARR) provides insights into the total contracted revenue your SaaS business expects to generate in a year, based on current subscriptions. Monitoring ARR helps you understand the long-term financial performance, measure customer retention, and establish sales targets.
Customer Lifetime Value (CLV)
Customer Lifetime Value (CLV) is the projected revenue a customer will generate throughout their entire relationship with your SaaS business. By calculating CLV, you can make strategic decisions regarding customer acquisition and retention, optimize pricing strategies, and prioritize efforts to maximize profitability.
Customer Acquisition Cost (CAC)
Customer Acquisition Cost (CAC) measures the average cost to acquire a new customer. By tracking the relationship between CAC and CLV, you can determine the efficiency of your sales and marketing efforts, optimize budget allocation, and ensure positive return on investment (ROI).
Churn Rate
Churn Rate represents the percentage of customers who cancel or do not renew their subscriptions within a specific period. Monitoring churn rate helps you address customer satisfaction issues, improve retention strategies, and maintain a healthy customer base.
Expansion Revenue
Expansion Revenue measures the additional revenue generated from existing customers through upselling, cross-selling, or upgrades. Tracking expansion revenue allows you to identify upsell opportunities, understand customer needs, and maximize revenue potential.
Net Revenue Retention
Net Revenue Retention calculates the overall revenue retained from existing customers after accounting for churn and expansion revenue. By measuring net revenue retention, you can assess customer loyalty, identify trends, and determine the effectiveness of your customer retention strategies.
By tracking these essential SaaS sales metrics, you can gain valuable insights into the performance and growth of your business. With a deeper understanding of revenue trends, customer acquisition and retention, and overall sales effectiveness, you can refine your strategies, make informed decisions, and drive success in the competitive SaaS market.
Sales KPIs by Team Type
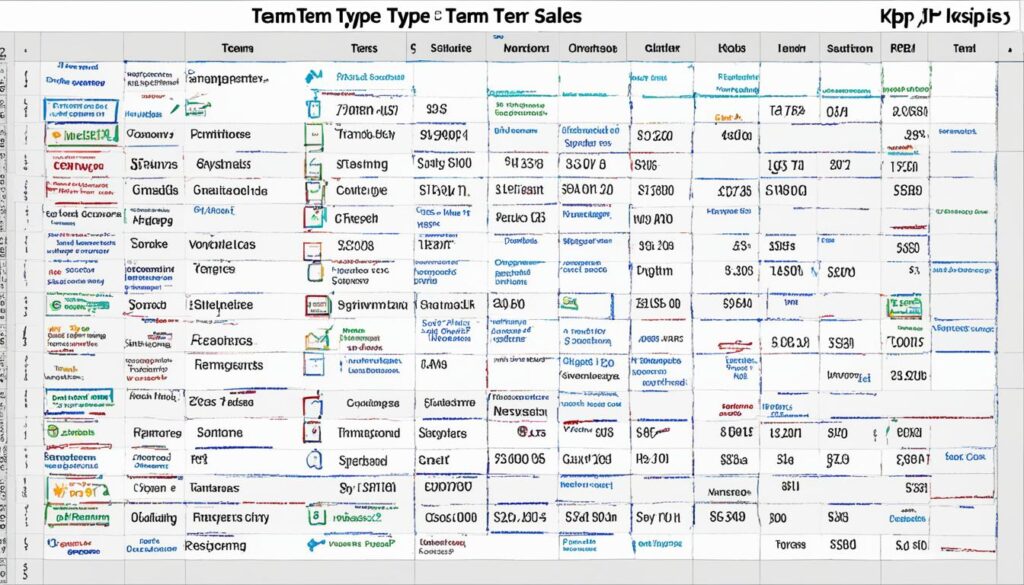
Different sales teams may have different key performance indicators (KPIs) based on their specific goals and strategies. These KPIs should align with your overall business objectives and provide valuable insights into the performance and effectiveness of your sales efforts. By tracking the right KPIs, you can better evaluate your team’s performance, identify areas for improvement, and make data-driven decisions to drive results and boost revenue.
Inside Sales Teams
Inside sales teams focus on selling remotely, primarily through phone calls or online channels. For these teams, some key KPIs to track include:
- Number of calls made: This metric helps measure the team’s outreach efforts and engagement with potential customers.
- Number of demos scheduled: Tracking this KPI allows you to monitor the team’s ability to book product demonstrations, a critical step towards closing deals.
- Conversion rate: This indicator measures the effectiveness of your team’s sales pitch and their ability to convert prospects into customers.
Field Sales Teams
Field sales teams, on the other hand, focus on selling in-person and building relationships with clients. For these teams, consider tracking the following KPIs:
- Number of in-person meetings: Monitoring this metric helps evaluate the team’s ability to secure face-to-face meetings with potential customers.
- Average deal size: This KPI provides insights into the team’s success in closing high-value sales deals.
- Win rate: Tracking the win rate helps you assess the team’s closing abilities and identify areas for improvement.
Remember, sales KPIs should be tailored to your specific team type and goals. By identifying and tracking the most relevant indicators, you can gain a clear understanding of your team’s performance, make informed decisions, and drive sales success.

| Sales Team Type | Key Performance Indicators (KPIs) |
|---|---|
| Inside Sales Teams | Number of calls made |
| Number of demos scheduled | |
| Conversion rate | |
| Field Sales Teams | Number of in-person meetings |
| Average deal size | |
| Win rate |
Sales KPI Template
Creating a sales KPI template is a powerful tool to help you effectively track and measure your performance. By including key metrics and indicators that align with your business’s goals and strategies, you can gain valuable insights and make data-driven decisions to drive results. Consistently monitoring and analyzing sales KPIs enables you to identify areas for improvement, optimize your sales efforts, and achieve success.
Here are some common sales KPIs that you should include in your template:
- Total revenue: Measure the overall revenue generated by your sales efforts.
- Revenue by product or service: Evaluate the performance and profitability of individual products or services.
- Market penetration: Assess the extent to which you’ve captured your target market.
- Percentage of revenue from new business: Track the proportion of revenue generated from new customers.
- Percentage of revenue from existing customers: Measure the contribution of your existing customer base to your revenue.
- Year-over-year growth: Monitor the growth rate of your sales performance compared to the previous year.
- Average customer lifetime value (CLV): Calculate the average value a customer brings to your business over their lifetime.
- Net promoter score (NPS): Evaluate customer satisfaction and loyalty to your brand.
- Number of deals lost to competition: Identify the number of deals you’ve lost to competitors.
- Cost of selling: Determine the expenses associated with your sales efforts.
- Average length of sales cycle: Measure the duration it takes to close a sale.
- Weighted value of pipeline: Assess the potential value of deals in your sales pipeline.
- Annual contract value (ACV): Calculate the average value of your annual contracts.
- Win rate: Determine the percentage of deals won out of the total number of opportunities.
- Conversion rate by sales funnel stage: Measure the effectiveness of your sales process at different stages of the funnel.
- Frequency/volume of new opportunities added to the pipeline: Track the number of new potential opportunities.
By customizing and utilizing this sales KPI template, you can gain a comprehensive view of your sales performance, make informed decisions, and drive your business towards success.

Conclusion
Sales metrics play a crucial role in evaluating the performance of your sales efforts and driving the success of your business. By tracking key sales metrics such as revenue, market penetration, customer acquisition, and sales growth, you can gain valuable insights into the effectiveness of your sales strategies. These insights enable you to make data-driven decisions, set realistic sales targets, and optimize your sales process.
Consistently monitoring and analyzing sales metrics empowers you to identify areas for improvement and make necessary adjustments to your sales strategies. By leveraging the power of data, you can refine your approach, improve your performance, and ultimately drive impressive results. Whether you’re aiming to increase revenue, expand your customer base, or enhance customer retention, sales metrics provide the information you need to take targeted actions that align with your business goals.
Start tracking your sales metrics today to unlock the full potential of your business. By implementing a comprehensive sales tracking system, you can gain valuable insights, make informed decisions, and achieve sustainable growth. Remember, staying on top of your sales metrics is the key to boosting your sales strategy, reaching your sales targets, and propelling your business to new heights of success!


